
In the realm of machine learning, supervised learning is one of the most widely-used techniques for predictive modeling. Linear regression, a simple yet powerful algorithm, is at the core of many supervised learning applications. In this blog post, we will delve into the basics of linear regression, its role in supervised learning, and how you can use it to solve real-world problems.
- Predicting numerical outcomes: Linear regression is highly effective in predicting continuous numerical values, such as house prices, stock market trends, or sales forecasts.
- Identifying relationships: By analyzing the coefficients of the linear regression model, you can identify the strength and direction of relationships between input features and the target output.
- Feature selection: Linear regression can be used to identify the most significant features that contribute to the target output, enabling you to focus on the most crucial variables in your dataset.
Context
There is a huge demand for used cars in the Indian Market today. As sales of new cars have slowed down in the recent past, the pre-owned car market has continued to grow over the past years and is larger than the new car market now. Cars4U is a budding tech start-up that aims to find footholds in this market.
In 2018-19, while new car sales were recorded at 3.6 million units, around 4 million second-hand cars were bought and sold. There is a slowdown in new car sales and that could mean that the demand is shifting towards the pre-owned market. In fact, some car sellers replace their old cars with pre-owned cars instead of buying new ones.
Unlike new cars, where price and supply are fairly deterministic and managed by OEMs (Original Equipment Manufacturer / except for dealership level discounts which come into play only in the last stage of the customer journey), used cars are very different beasts with huge uncertainty in both pricing and supply. Keeping this in mind, the pricing scheme of these used cars becomes important in order to grow in the market. As a senior data scientist at Cars4U, you have to come up with a pricing model that can effectively predict the price of used cars and can help the business in devising profitable strategies using differential pricing. For example, if the business knows the market price, it will never sell anything below it.
Objective
To explore and visualize the dataset, build a linear regression model to predict the prices of used cars, and generate a set of insights and recommendations that will help the business.
Data Description
The data contains the different attributes of used cars sold in different locations. The detailed data dictionary is given below.
Data Dictionary
- S.No.: Serial number
- Name: Name of the car which includes brand name and model name
- Location: Location in which the car is being sold or is available for purchase (cities)
- Year: Manufacturing year of the car
- Kilometers_driven: The total kilometers driven in the car by the previous owner(s) in km
- Fuel_Type: The type of fuel used by the car (Petrol, Diesel, Electric, CNG, LPG)
- Transmission: The type of transmission used by the car (Automatic/Manual)
- Owner: Type of ownership
- Mileage: The standard mileage offered by the car company in kmpl or km/kg
- Engine: The displacement volume of the engine in CC
- Power: The maximum power of the engine in bhp
- Seats: The number of seats in the car
- New_Price: The price of a new car of the same model in INR Lakhs (1 Lakh INR = 100,000 INR)
- Price: The price of the used car in INR Lakhs
We will start by following this methodology:
- Data Collection: Begin by collecting a dataset that contains the input features and corresponding car prices. This dataset will be split into a training set (used to train the model) and a testing set (used to evaluate the model’s performance).
- Data Preprocessing: Clean and preprocess the data, addressing any missing values or outliers, and scaling the input features to ensure that they are on the same scale.
- Model Training: Train the linear regression model on the training dataset. This step involves finding the best-fitting line that minimizes the error between the actual and predicted house prices. Most programming languages, such as Python, R, or MATLAB, have built-in libraries that simplify this process.
- Model Evaluation: Evaluate the model’s performance on the testing dataset by comparing its predictions to the actual car prices. Common evaluation metrics for linear regression include Mean Absolute Error (MAE), Mean Squared Error (MSE), and R-squared.
- Model Optimization: If the model’s performance is unsatisfactory, consider feature engineering, adding more data, or using regularization techniques to improve the model’s accuracy.
Importing Libraries
# Libraries to help with reading and manipulating data
import numpy as np
import pandas as pd

# Libraries to help with data visualization
import matplotlib.pyplot as plt
%matplotlib inline
import seaborn as sns
sns.set()

# Removes the limit for the number of displayed columns
pd.set_option("display.max_columns", None)
# Sets the limit for the number of displayed rows
pd.set_option("display.max_rows", 200)

#Train/Test/Split
from sklearn.model_selection import train_test_split # Sklearn package's randomized data splitting function

#Sklearn libraries
from sklearn.linear_model import LinearRegression
from sklearn.preprocessing import PolynomialFeatures
from sklearn import linear_model
from sklearn.metrics import mean_absolute_error, mean_squared_error, r2_score
from sklearn.preprocessing import OneHotEncoder

#Show all columns and randomize the row display
pd.set_option('display.max_columns', None)
pd.set_option('display.max_rows', 200)
Data Collection
This project was coded using Google Colab. The data was read directly from Google Drive.
#mount and connect Google Drive
from google.colab import drive
drive.mount('/content/drive')

#Import dataset "used_cars_data.csv"
data = pd.read_csv('/content/drive/My Drive/Colab Notebooks/used_cars_data.csv')
Data Preprocessing
Data preprocessing is a crucial initial step in the machine learning process, aimed at providing a comprehensive understanding of the dataset at hand. By investigating the underlying structure, patterns, and relationships within the data, the analysis allows practitioners to make informed decisions about feature selection, model choice, and potential preprocessing requirements. This process often involves techniques such as data visualization, summary statistics, and correlation analysis to identify trends, detect outliers, and assess data quality. Gaining insights through data exploratory analysis not only helps in uncovering hidden relationships and nuances in the data but also aids in hypothesis generation and model validation. Ultimately, a thorough exploratory analysis sets the stage for building more accurate and reliable machine learning models, ensuring that the data-driven insights derived from these models are both meaningful and actionable. Review the Dataset
#Sample of (10) rows
data.sample(10)
#Number of rows and columns
print(f'Number of rows: {data.shape[0]} and Number of columns: {data.shape[1]}')
#Drop S.No. column
data.drop(['S.No.'], axis=1, inplace=True)
data.reset_index(inplace=True, drop=True)
#Review the datatypes
data.info()
- (3) float64
- (3) int64
- (8) object
- Engine: .6% of values are missing
- Power: 2.4% of values are missing
- Milage: 0.003% of values are missing
- Seats: 0.73% of values are missing
- Price: 17% of values are missing
#Statistical analysis of dataset
data.describe().T
- Mean: 2013
- Min: 1996
- Max: 2019
- Mean: 58699.06
- Min: 171.00
- Max: 6,500,000.00
- Mean: 5.28
- Min: 0.00
- Max: 10.00
- Mean: 21.30
- Min: 3.91
- Max: 375.00
- Mean: 9.48
- Min: 0.44
- Max: 160.00
#Check for duplicates
data.duplicated().sum()

#Dropping duplicated rows
data.drop_duplicates(keep ='first',inplace = True)


#Confirm duplicated are removed
data.duplicated().sum()
#Create a new column of make by separating it from the name
data['Make'] = data['Name'].str.split(' ').str[0]

#Dropping name column
data.drop(['Name'], axis = 1, inplace=True) data.reset_index(inplace=True, drop=True)
#Convert make column from object to category
data['Make'] = data['Make'].astype('category', errors = 'raise')

#Confirm datatype
data['Make'].dtype
#How many values for each make
pd.DataFrame(data[['Make']].value_counts(ascending=False))
#Consolidate make Isuzu into one category
data.loc[data['Make'] == 'ISUZU','Make'] = 'Isuzu'
data['Make']= data['Make'].cat.remove_categories('ISUZU')
#Countplot of the make column
plt.figure(figsize = (30,8))
ax = sns.countplot(x = 'Make', data = data)
ax.set_xticklabels(ax.get_xticklabels(), rotation = 90);
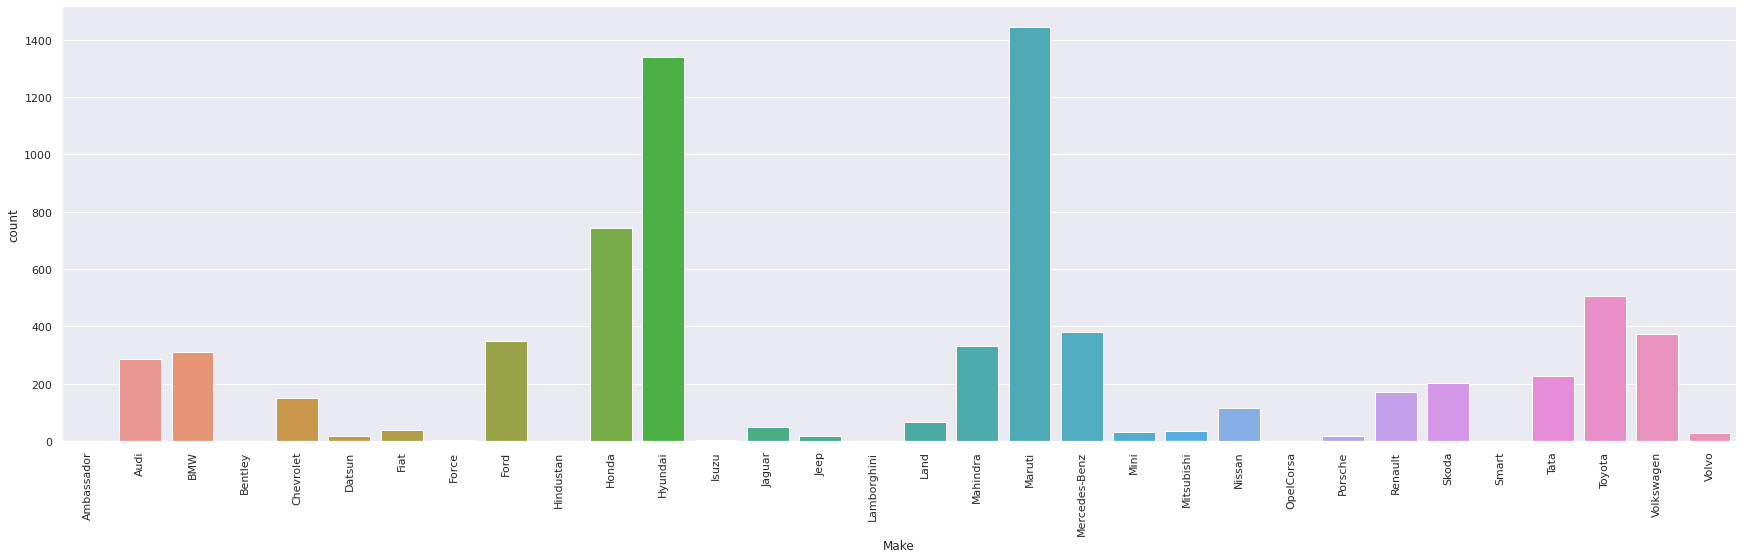 The top five makes based on the results are:
- Maruti: 1404
- Hyundai: 1284
- Honda: 734
- Toyota: 481
- Mercedes-Benz: 378
#Missing data for price
data['Price'].isnull().sum()

#Replace NaN values in the price column with the median
data['Price'] = pd.DataFrame(data['Price'].fillna(int(data['Price'].median())))
#Review the price breakdown
pd.set_option('display.max_rows', 10)
pd.DataFrame(data['Price'].value_counts(ascending=False))
#Statistical analysis of price
pd.DataFrame(data['Price']).describe().T
#Average price of cars by make
avg_price = data.groupby(['Make'])['Price'].mean().fillna(0).sort_values(ascending= False).index
#catplot of make and price
sns.catplot(x = "Make", y = "Price", data = data, kind = 'bar', height = 7, aspect = 2, order = avg_price).set(title = 'Price by Make')
plt.xticks(rotation=90);
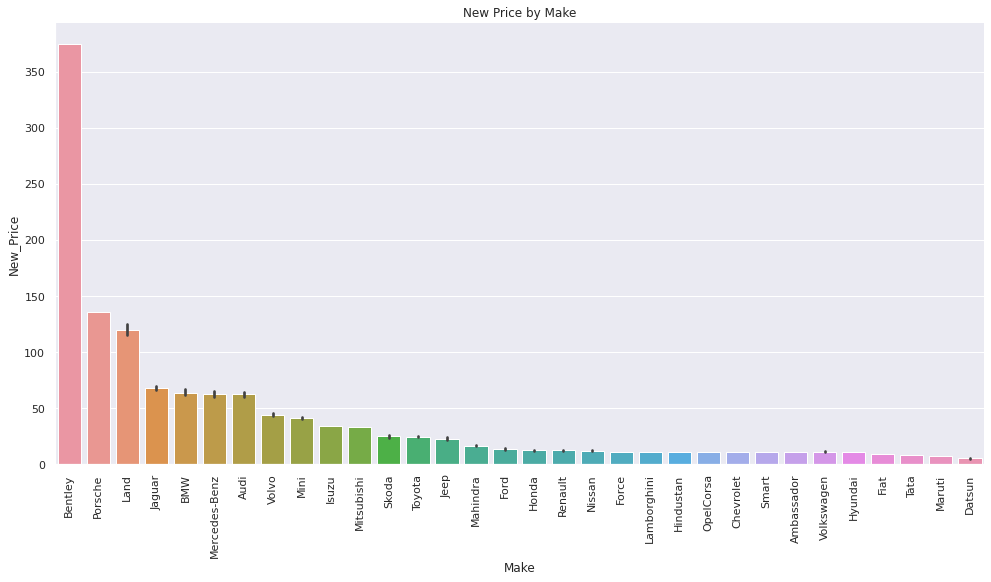
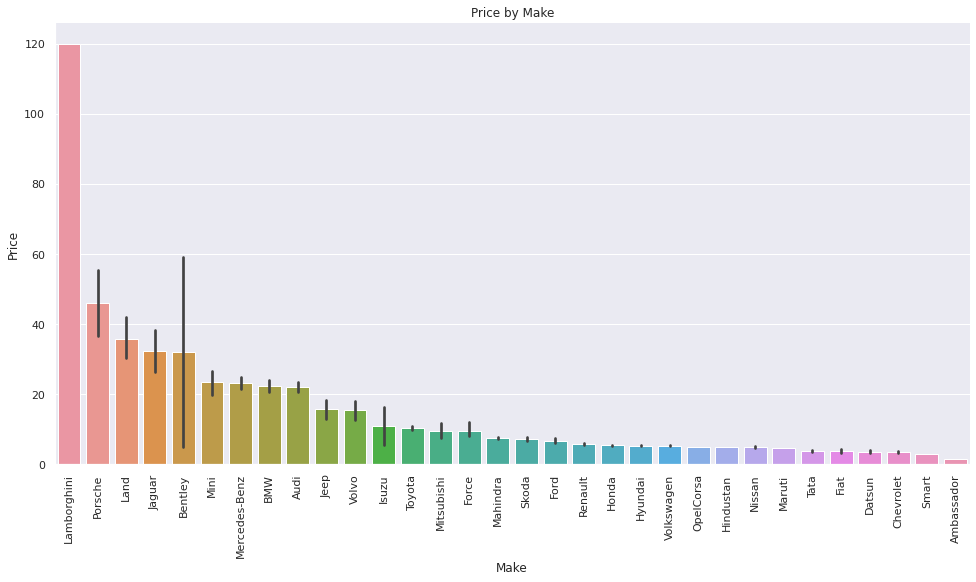 It is interesting to note the difference between the average cost of new cars of the same make and the used cars available at Cars4U:
#Average new price of cars by make
avg_new_price = data.groupby(['Make'])['New_Price'].mean().fillna(0).sort_values(ascending= False).index

#catplot of make and new price
sns.catplot(x = "Make", y = "New_Price", data = data, kind = 'bar', height = 7, aspect = 2, order = avg_new_price ).set(title = 'New Price by Make') plt.xticks(rotation=90);
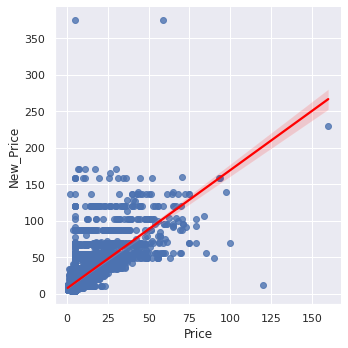
 We can see that there is a moderate positive correlation between the price of a new car and the price of the cars at Cars4U:
#Correlation between price and new price
data[['New_Price', 'Price']].corr()
 Next, we converted the transmission data to categorical data and reviewed the breakdown between automatic and manual transmission cars:
#Convert Transmission column from object to category
data['Transmission'] = data['Transmission'].astype('category', errors = 'raise')

#Displot of the transmission column
plt.figure(figsize = (8,8))
sns.displot(x = 'Transmission', data = data);
#Specific value counts for each transmission types
pd.DataFrame(data[‘Transmission’].value_counts(ascending=False))
#Average price of cars by make with manual transmissions
man_price = data.groupby(['Make'])['Price'].mean().fillna(0).sort_values(ascending= False).index
#catplot of make and price for all manual transmissions
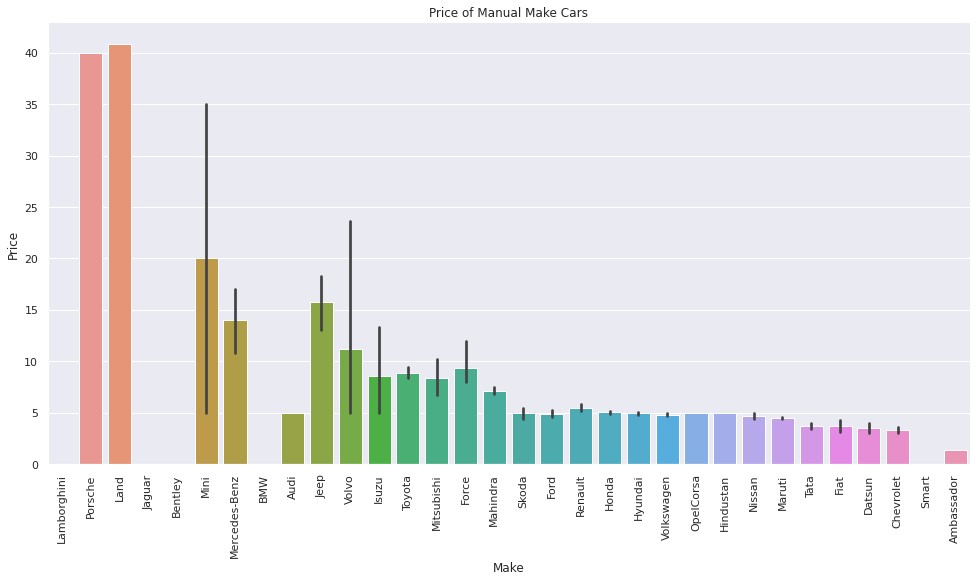
sns.catplot(x = "Make", y = "Price", data = manual, kind = 'bar', height = 7, aspect = 2, order = man_price).set(title = 'Price of Manual Make Cars')
plt.xticks(rotation=90);
#Average new price of cars by make with manual transmissions
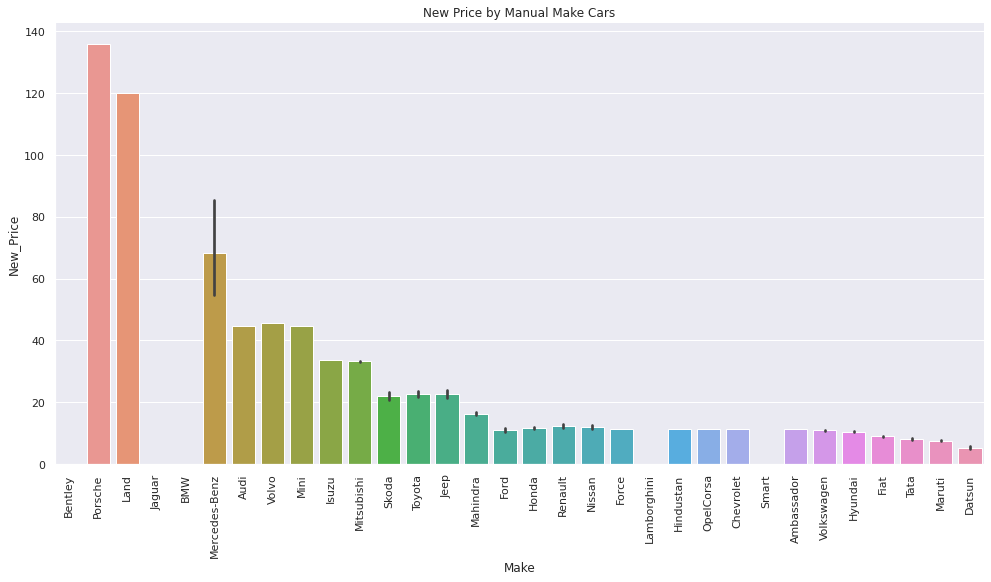
man_cars = data.groupby(['Make'])['New_Price'].mean().fillna(0).sort_values(ascending= False).index
#catplot of make and price for all manual transmissions
sns.catplot(x = "Make", y = "New_Price", data = manual, kind='bar', height=7, aspect=2, order= man_cars).set(title = 'New Price by Manual Make Cars')
plt.xticks(rotation=90);
#Difference between the mean price and mean new price of manual cars
manual['Price'].mean()/manual['New_Price'].mean()
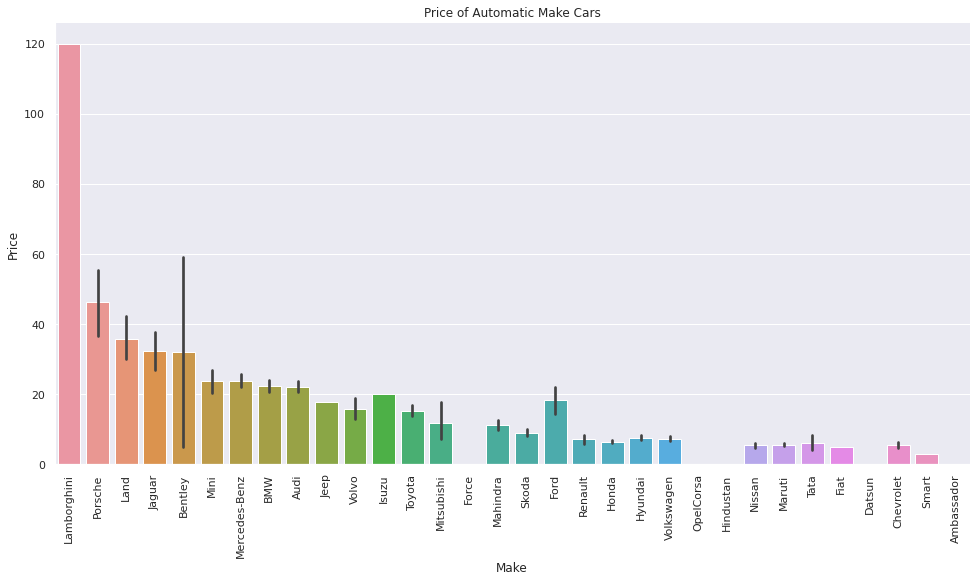
 It is interesting to note that there is a smaller difference in price between used and new car prices for cars with automatic transmissions – a difference of only 38.7%.
#Average price of cars by make with automatic transmissions
auto_price = data.groupby(['Make'])['Price'].mean().fillna(0).sort_values(ascending= False).index

#catplot of make and price for all automatic transmissions
sns.catplot(x = "Make", y = "Price", data = automatic, kind = 'bar', height = 7, aspect = 2, order = auto_price).set(title = 'Price of Automatic Make Cars') plt.xticks(rotation=90);

#Average new price of cars by make automatic transmissions
new_auto = data.groupby(['Make'])['New_Price'].mean().fillna(0).sort_values(ascending= False).index #catplot of make and new price for all automatic transmissions sns.catplot(x = "Make", y = "New_Price", data = automatic, kind = 'bar', height = 7, aspect = 2, order = new_auto).set(title = 'New Price of Automatic Make Cars') plt.xticks(rotation=90); #Difference between the mean price and mean new price of automatic cars automatic['Price'].mean()/automatic['New_Price'].mean()
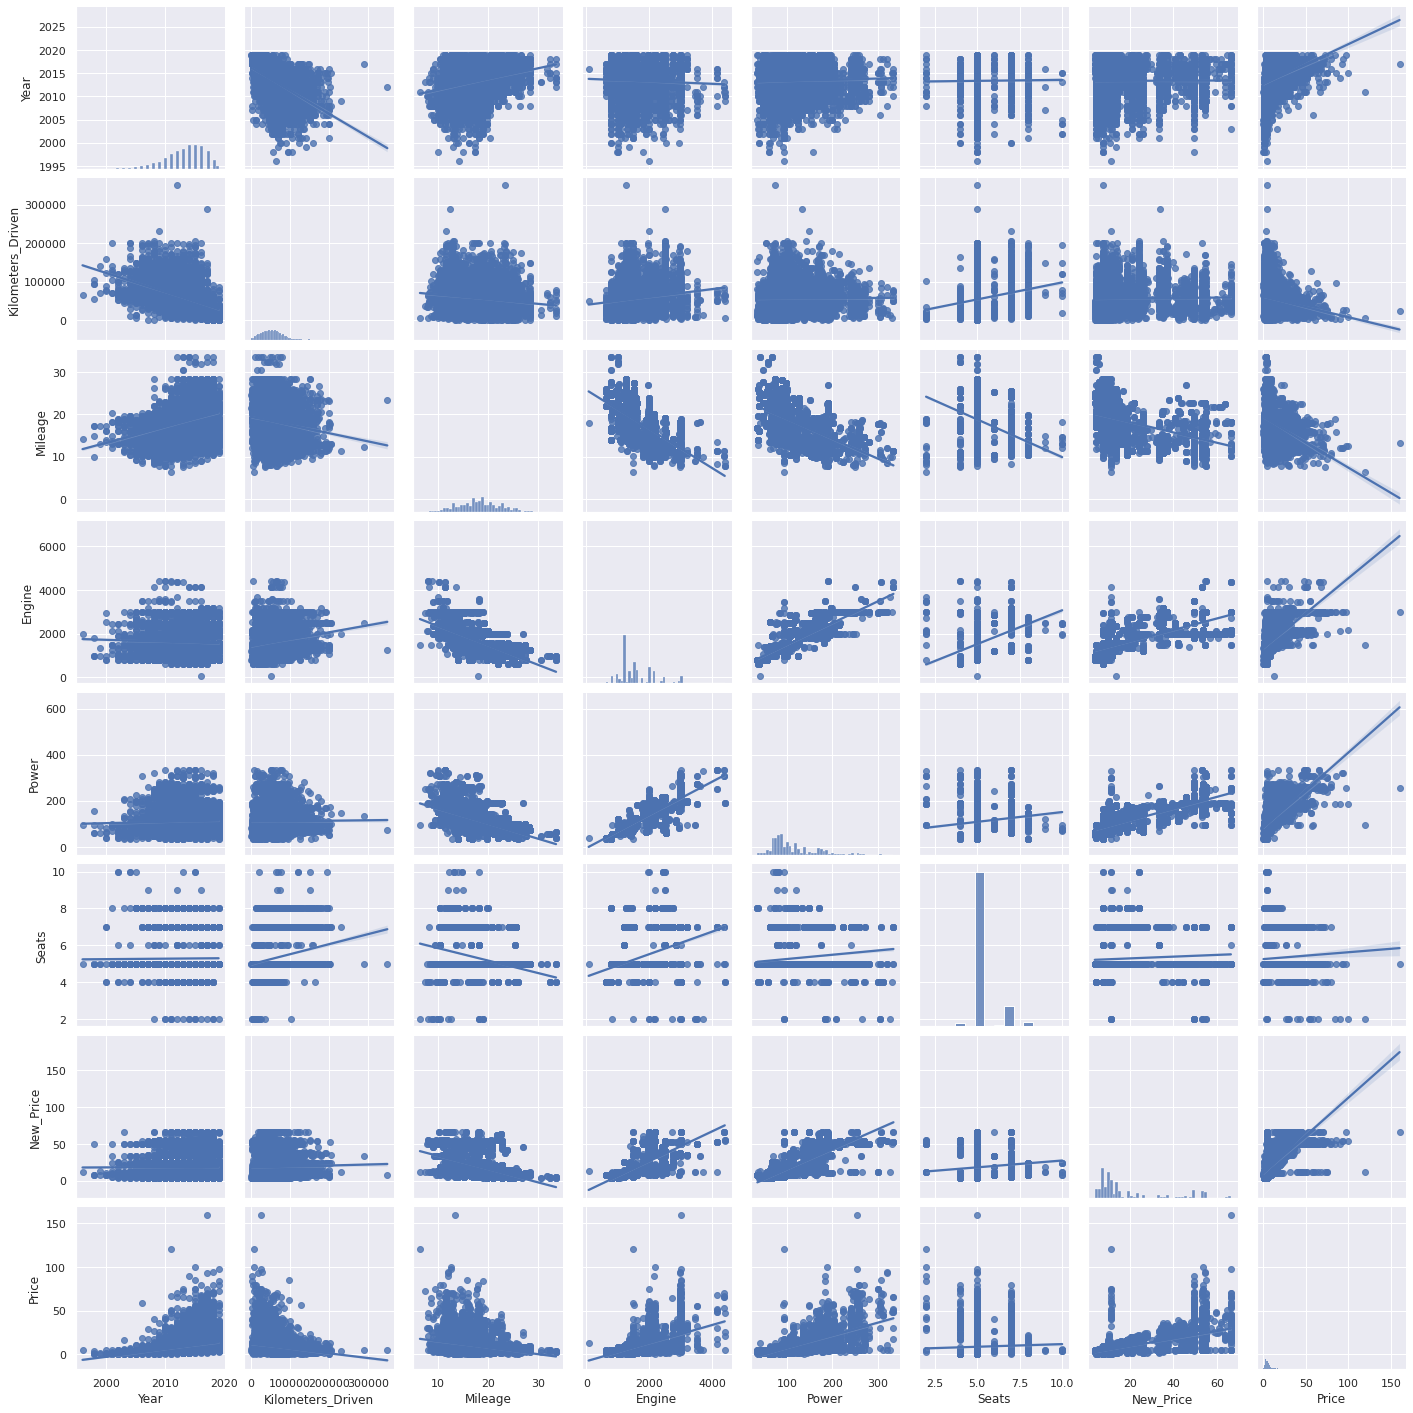
 There are other features that we can explore in our exploratory data analysis (all of which you can view on the GitHub repo found here, but we will now evaluate the correlation between all these features to help identify the strength of their relationships. One thing that is important to keep in mind when completing the data analysis is the ensure that all features containing NaN or have no data are either dropped or imputed. It is also important to treat any outliers that could potential skew your dataset and have an adverse impact on your model metrics. For example, the power feature contained a number of outliers that we treated by first converting them to NaN values with NumPy and replacing them with the median central tendency:
#Treating the outliers for power
power_outliers = [340., 360., 362.07, 362.9, 364.9, 367., 382., 387.3, 394.3, 395., 402., 421., 444., 450., 488.1,
                   500., 503., 550., 552., 560., 616.]
data['Power_Outliers'] = data['Power']
#Replacing the power values with np.nan
for outlier in power_outliers:
    data.loc[data['Power_Outliers'] == outlier, 'Power_Outliers'] = np.nan
data['Power_Outliers'].isnull().sum()

#Group the outliers by Make and impute with median
data['Power_Outliers'] = data.groupby(['Make'])['Power_Outliers'].apply(lambda fix : fix.fillna(fix.median()))
data['Power_Outliers'].isnull().sum()
#Transfer new data back to original column
data['Power'] = data['Power_Outliers']
#Drop Power_Outliers since it is no longer needed
data.drop(['Power_Outliers'], axis=1, inplace=True)
data.reset_index(inplace=True, drop=True)
 Here is a heat map of the correlations represented above:
 To better improve our model. we have performed log transformations on our price feature. Log transformations are a common preprocessing technique used in machine learning to modify the distribution of data features. They can be particularly useful when dealing with data that has a skewed distribution, as log transformations can help make the data more normally distributed, which can improve the performance of some machine learning algorithms. The main reasons for using log transformations are:
- Reduce skewness: Log transformations can help reduce the skewness of the data by compressing the range of large values and expanding the range of smaller values. This helps in transforming a skewed distribution into a more symmetrical, bell-shaped distribution, which is often assumed by many machine learning algorithms.
- Stabilize variance: In some cases, the variance of a dataset may increase with the magnitude of the data. Log transformations can help stabilize the variance by reducing the impact of extreme values, making the data more homoscedastic (having a constant variance).
- Improve interpretability: When dealing with data that spans several orders of magnitude, log transformations can make the data more interpretable by converting multiplicative relationships into additive ones. This can be particularly useful for understanding the relationship between variables in regression models.
- Enhance algorithm performance: Many machine learning algorithms, such as linear regression, assume that the input features have a normal (Gaussian) distribution. Applying log transformations can help meet these assumptions, leading to better algorithm performance and more accurate predictions.
- Handle multiplicative effects: Log transformations can help model multiplicative relationships between variables, as the logarithm of a product is the sum of the logarithms of its factors. This property can help simplify complex relationships in the data and make them easier to model.
#Create log transformation columns
data['Price_Log'] = np.log(data['Price'])
data['New_Price_Log'] = np.log(data['New_Price'])
data.head()
 The last step in our data preprocessing step is to use one-hot encoding on our categorical variables.
One-Hot Encoding is a technique used in machine learning to convert categorical variables into a binary representation that can be easily understood and processed by machine learning algorithms. Categorical variables are those that take on a limited number of distinct categories or levels, such as gender, color, or type of car. Most machine learning algorithms require numerical input, so converting categorical variables into a numerical format is a crucial preprocessing step.
The one-hot encoding process involves creating new binary features for each unique category in a categorical variable. Each new binary feature represents a specific category and takes the value 1 if the original variable’s value is equal to that category, and 0 otherwise. Here’s a step-by-step explanation of the one-hot encoding process:
The last step in our data preprocessing step is to use one-hot encoding on our categorical variables.
One-Hot Encoding is a technique used in machine learning to convert categorical variables into a binary representation that can be easily understood and processed by machine learning algorithms. Categorical variables are those that take on a limited number of distinct categories or levels, such as gender, color, or type of car. Most machine learning algorithms require numerical input, so converting categorical variables into a numerical format is a crucial preprocessing step.
The one-hot encoding process involves creating new binary features for each unique category in a categorical variable. Each new binary feature represents a specific category and takes the value 1 if the original variable’s value is equal to that category, and 0 otherwise. Here’s a step-by-step explanation of the one-hot encoding process:
- Identify the categorical variable(s) in your dataset.
- For each categorical variable, determine the unique categories.
- Create a new binary feature for each unique category.
- For each instance (row) in the dataset, set the binary feature value to 1 if the original variable’s value matches the category represented by the binary feature, and 0 otherwise.
- It creates a binary representation that is easy for machine learning algorithms to process and interpret.
- It does not impose an ordinal relationship between categories, which may not exist in the original data.
- It can lead to a large increase in the number of features, especially when dealing with categorical variables with many unique categories. This can increase memory usage and computational time.
- It does not capture any relationship between categories, which may be present in some cases.
#One-hot encoding our variables
data = pd.get_dummies(data, columns=['Location', 'Fuel_Type','Transmission','Owner_Type','Make'], drop_first=True)
Model Training, Model Evaluation, and Model Optimization
#Select Independent and Dependent Variables
a = data1.drop(['Price'], axis=1)
b = data1["Price"]
#Splitting the data in 70:30 ratio for train to test data
a_train, a_test, b_train, b_test = train_test_split(a, b, test_size=0.30, random_state=1)
#View split
print(“Number of rows in train data =”, a_train.shape[0]) print(“Number of rows in test data =”, a_test.shape[0])
#Fit model_one
model_one = LinearRegression()
model_one.fit(a_train, b_train)
#Checking model performance on train set
print("Training Performance")
print('\n')
training_perfomace_1 = model_performance_regression(model_one, a_train, b_train)
training_perfomace_1
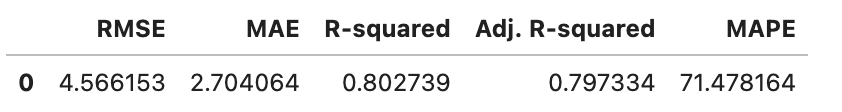
#Checking model performance on test set
print("Test Performance")
print("\n")
test_performance_1 = model_performance_regression(model_one, a_test, b_test)
test_performance_1

#Coefficients and intercept of model_one
coef_data_1 = pd.DataFrame(np.append(model_one.coef_, model_one.intercept_), index=a_train.columns.tolist() + ["Intercept"], columns=["Coefficients"],)
coef_data_1
#Evaluation of Feature Importance
imp_1 = pd.DataFrame(data={
    'Attribute': a_train.columns,
    'Importance': model_one.coef_
})
imp_1 = imp_1.sort_values(by='Importance', ascending=False)
imp_1
- Price_Log
- Make_Porsche
- Make_Bentley
- Owner_Type_Third
- Location_Jaipur
- y is the predicted value of the target variable
- β0 is the intercept (also known as the bias term)
- β1, β2, …, βn are the coefficients for each input feature (x1, x2, …, xn)
- ε is the residual error term
#Equation of linear regression
equation_one = "Price = " + str(model_one.intercept_)
print(equation_one, end=" ")

for i in range(len(a_train.columns)):
    if i != len(a_train.columns) - 1:
        print("+ (", model_one.coef_[i],")*(", a_train.columns[i],")",end="  ",)
    else:
        print("+ (", model_one.coef_[i], ")*(", a_train.columns[i], ")")
#PolynomialFeatures Transformation
poly = PolynomialFeatures(degree=2, interaction_only=True)
a_train2 = poly.fit_transform(a_train)
a_test2 = poly.fit_transform(a_test)
poly_clf = linear_model.LinearRegression()
poly_clf.fit(a_train2, b_train)
print(poly_clf.score(a_train2, b_train))
- Coimbatore, Banglore, and Kochi are locations that have the highest mean price for cars sold. Dealerships using these models should seek to increase marketing efforts here to increase sales. Accordingly, they should evaluate whether locations that have a negative impact on price (such as Kolkata) should remain open.
- Offer more of an inventory of electric cars at the Coimbatore, Banglore, and Kochias locations. This had a positive impact on price.
- Cars 2016-newer yield higher prices, but many customers have cars that are between 2012-2015. Look to load your inventory with cars that are only 2012 or newer as these are the most desirable.
- While more customers have manual transmission cars, automatic cars almost always yield higher prices.
- Since traffic is always a pain point, acquiring more automatic cars (which are also more fuel efficient) will increase price.
- Dealerships should look to acquire makes like Maruti, Hyundai, and Honda’s as these are the most popular selling brands.
Very interesting details you have observed, appreciate it for putting up.